


Rethinking Forecast Accuracy through an Outcome-driven BI approach
Working with data has increasingly become a business-driven activity rather than purely an IT responsibility. Where traditional BI often focused on reporting and systems, organizations today are moving toward an outcome-driven approach, where data initiatives are closely aligned with business goals and tangible results.
I wrote about this shift from traditional BI to outcome-driven BI in an earlier blog post. But how do you actually put this into practice? And what does that look like when applied to a concrete example like forecast accuracy?
In this blog, I’ll explain why reporting on forecast bias offers a more outcome-driven BI approach than relying on relative forecast accuracy measures (all measures expressed as percentages). These accuracy measures often present a skewed view of performance, and their limitations are easily overlooked. However, reporting on bias leads to more actionable insights.
Humans don’t like uncertainty
Everyone wants more control over forecast accuracy in order to reduce the uncertainty of the future, because who doesn’t want to feel a little more certain about what’s coming? But in practice, the value we get from relative measures is often quite limited. It typically goes something like this:
“What was our forecast accuracy last month?”
“85%, the month before it was 84%.”
“Great, keep it up: let’s aim for another percent next month!”
A month later:
“So, how did we do?”
“84.5%.”
“Hm, it decreased compared to last month… let’s try to get it back above 85%.”
Relative forecast accuracy measures are skewed
Of course, you can look at which areas have gone down in forecast accuracy. But in reality, it is hard to really understand your forecast performance when using relative accuracy measures. This has a lot to do with how these measures are calculated. Often, companies use MAPE, wMAPE or MAE %. We like to see percentages because they help us scale the impact based on demand. That is why these numbers are often divided by actuals, but this results in skewed metrics. Skewness shows whether data is unevenly distributed, meaning it leans more to one side instead of being balanced around the average. Let me explain this in the following example.
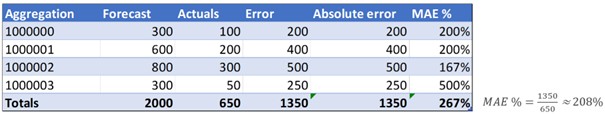
Suppose I’m measuring forecast accuracy at an aggregated level using MAE % as forecast accuracy measure. In Figure 1, it appears that my forecast is consistently much higher than the actuals. The total MAE % is calculated as the ratio of the sum of absolute errors, 1350, to the sum of actuals, 650. In this case, the total MAE % is 208%.
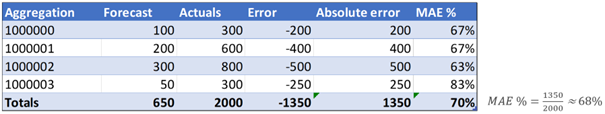
That’s why relative forecast accuracy measures can be skewed: overforecasting is penalized more than underforecasting. In this example, it is 68% versus 208% using the exact same numbers. So technically, it is easy to improve your forecast accuracy by simply lowering your forecasts. But in demand planning, that is a bad idea. It can lead to underordering, stockouts, and serious service issues. So, what should you do instead?
Don’t get stuck on forecast accuracy, focus on forecast bias instead
Focusing on forecast bias would be much more outcome-driven. Bias is nothing more than the average error, where the error is forecast minus actuals. To start with the disadvantage: positive errors offset negative errors. A bias of zero doesn’t mean the forecast is always perfect. But it is still a powerful KPI, because it reflects the overall tendency to overforecast or underforecast. Structural overforecasting and underforecasting are signs of problems in the process. And process issues can be solved. So, if you are looking for actionable insights related to forecasting, start with bias. Let me illustrate this with a simple example. For context, I’m not exactly a darts talent, although it might be my last realistic shot at becoming a professional athlete. I threw three sets of three darts, aiming for the bullseye at the center of the board. As you can see, my attempts are clearly biased since I consistently hit the top right of the target (Figure 3). This shows a clear process issue in my hand-eye coordination.

So, what did I do? I thought, let me focus on T16 (triple 16, at the bottom left of the target) to try to hit the bullseye this time. I still didn’t hit the bullseye, but I came much closer (Figure 4). The bias is clearly reduced.

Now what? What else can I do to improve? Other than weeks, months, or years of training, probably not much. But with my lack of talent, I am not sure how much I can actually improve. The same goes for your forecasts. You are not sure how much you can improve beyond correcting bias. It is very questionable whether it is worth investing in further improvements.
Back to outcome-driven BI
This darts example clearly illustrates the essence of outcome-driven BI. The true value of this approach lies in focusing on bias, which helps uncover structural patterns and highlights where improvements in the forecasting process are needed. Simply relying on relative forecast accuracy measures without fully understanding their limitations can lead to misleading conclusions. These measures often hide important details due to skewness and do not always reflect what is truly happening in the business. Outcome-driven BI means looking beyond percentages to understand the real issues, so you can make better, actionable decisions.
Accept what you can control to make better forecasts
If you want to improve your forecasts, start by identifying potential pitfalls in the process. Bias is a powerful tool for this because it highlights where overforecasting or underforecasting occurs, whether by product category or other dimensions. Accepting that noise and variation can only be predicted to a limited extent allows you to focus on what you can control: reducing bias. While it might be possible to influence noise, consider the effort and investment required and whether it is worth it. Begin simply by minimizing bias and use KPIs you can actively manage. Ensuring your reporting is outcome-driven will make your data organization more future proof and better equipped to support effective decision-making.
Author: Gert Jan Toering (Data strategist)