

Business Insights from Chain Analytics turns fragmented reporting into outcome-driven data products your teams actually use. Built on a single Enterprise Data Model and delivered per business domain, each product starts with the reports and decisions it needs to support, not the dashboard itself.
Business Insights
- Home
- Business Insights
// The Basics
Data products by domain
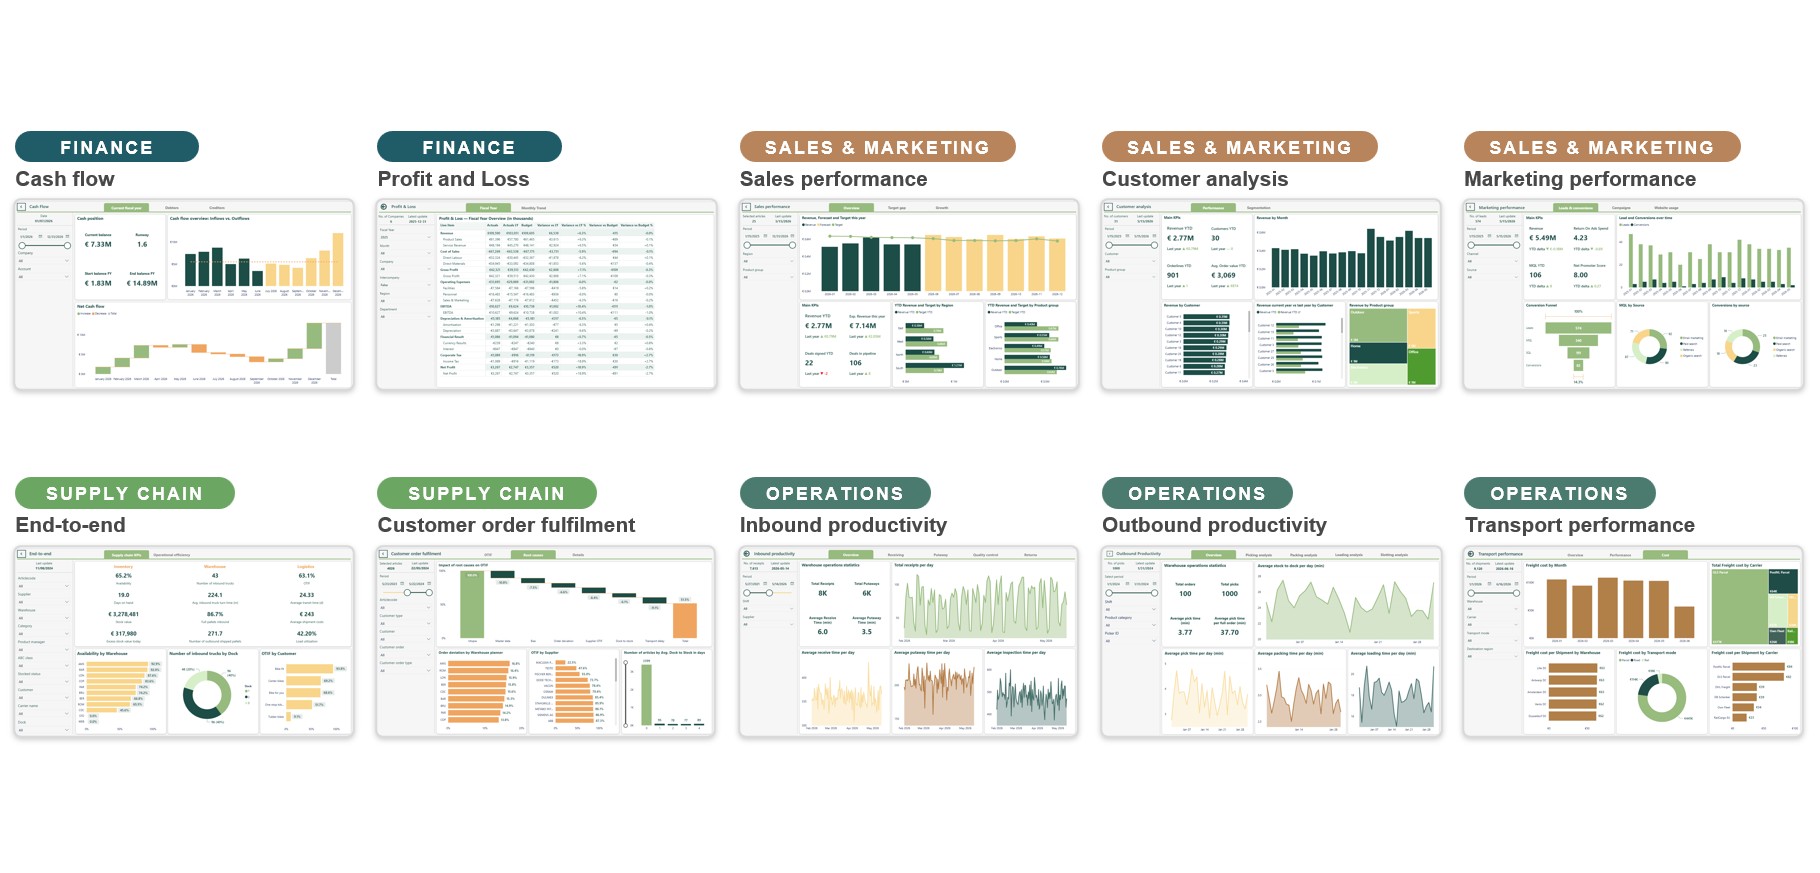
Every organisation asks the same core questions: where is the cash going, which customers drive margin, how reliable is our delivery, how productive is the warehouse. Our data products answer them per domain: Finance, Sales & Marketing, Supply chain and Operations, as ready-to-use reporting on top of the Enterprise Data Model.
Because every domain shares one model, the insights connect. An order fulfilment problem can be traced from customer to warehouse to carrier in a single view, instead of across three separate reports that don’t quite agree with each other.
Finance gets real-time visibility into cash flow and working capital. Sales & Marketing sees which customers and products actually drive margin, not just revenue. Supply Chain can track delivery reliability against commitments, not just against the plan. And Operations gains one consistent way to measure warehouse and production productivity across every site. Business Insights sits on top of Data Foundation. The same Enterprise Data Model that powers governed data products also feeds these reports, so numbers do not drift between the platform and the dashboard.
// Reporting
Power BI
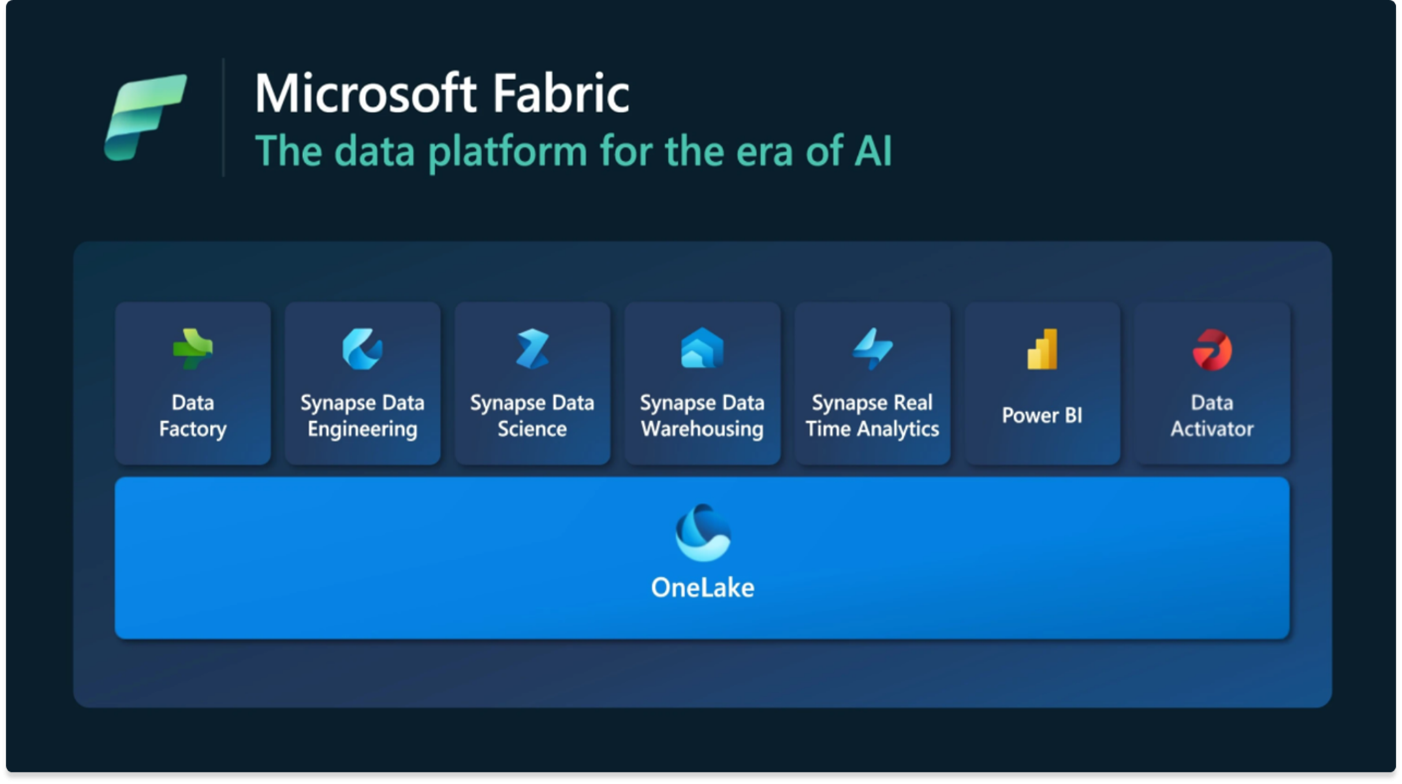
Power BI is where the model becomes visible: interactive reporting that connects directly to your data and lets people explore it themselves, from a board-level KPI down to the individual order behind it. Today, Power BI is fully integrated into Microsoft Fabric: where data and reporting comes together.
With more than 375 Power BI implementation projects worldwide, we’ve learned that the difference between a report that gets used and one that gets ignored is rarely the tooling. It’s the model underneath, definitions people trust, and a design that answers the question the user actually has.
We build governed, reusable semantic models rather than one-off reports, so a metric defined once means the same thing in every dashboard. Business users get self-service exploration within those guardrails, without duplicating logic or definitions across teams. That combination, a Fabric-native platform and a proven Power BI practice, means new domains can be added without rebuilding the model from scratch.
// From data to action
Actionable insights
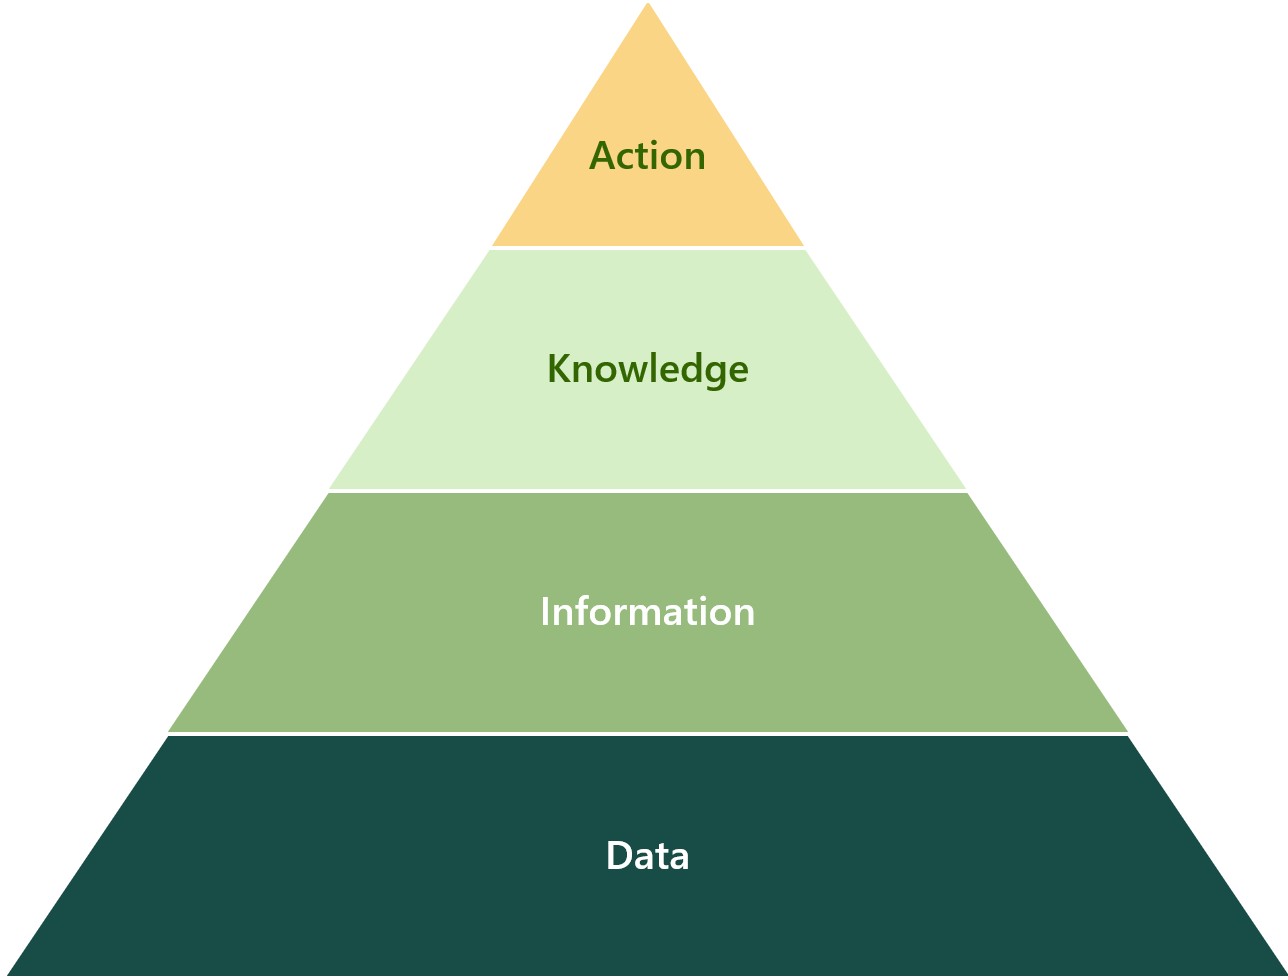
A report that only shows what happened leaves the hardest part to the user. Our data products are tailor-made to answer real business questions, so every view points towards a decision: what needs attention, where, and why now.
That comes from working outcome-driven. We start every data product from the decision it has to support and the outcome you want to improve, whether that’s margin, service level, working capital, or productivity, and work backwards from there to the metrics, the model and the sources. Not the other way around, where whatever data happens to be available determines what the report ends up showing.
It means fewer dashboards, but ones that are used. And it makes the value of each data product measurable: you know which decision it improves, so you can tell whether it is actually working.
In practice, that might mean a working capital dashboard for a CFO, or a delivery reliability report for a supply chain lead. Each one starts as a business question, not a data table. When the same underlying model also feeds Decision Intelligence, the same trusted data powers both reporting and AI-driven recommendations. Ready to see what a domain-specific data product looks like for your organisation? Get in touch to discuss where Business Insights fits your data foundation.